Why We Built LakeSentry
We built LakeSentry to give Databricks teams transparency into cost, usage, and adoption — so they understand what's happening and can act safely.
If you’ve run Databricks for any length of time, you’ve probably been in this conversation: the bill goes up, a finance partner asks about it in a review, and before anyone can talk about bringing costs down, the team gets stuck on a more basic question: what actually changed, and why?
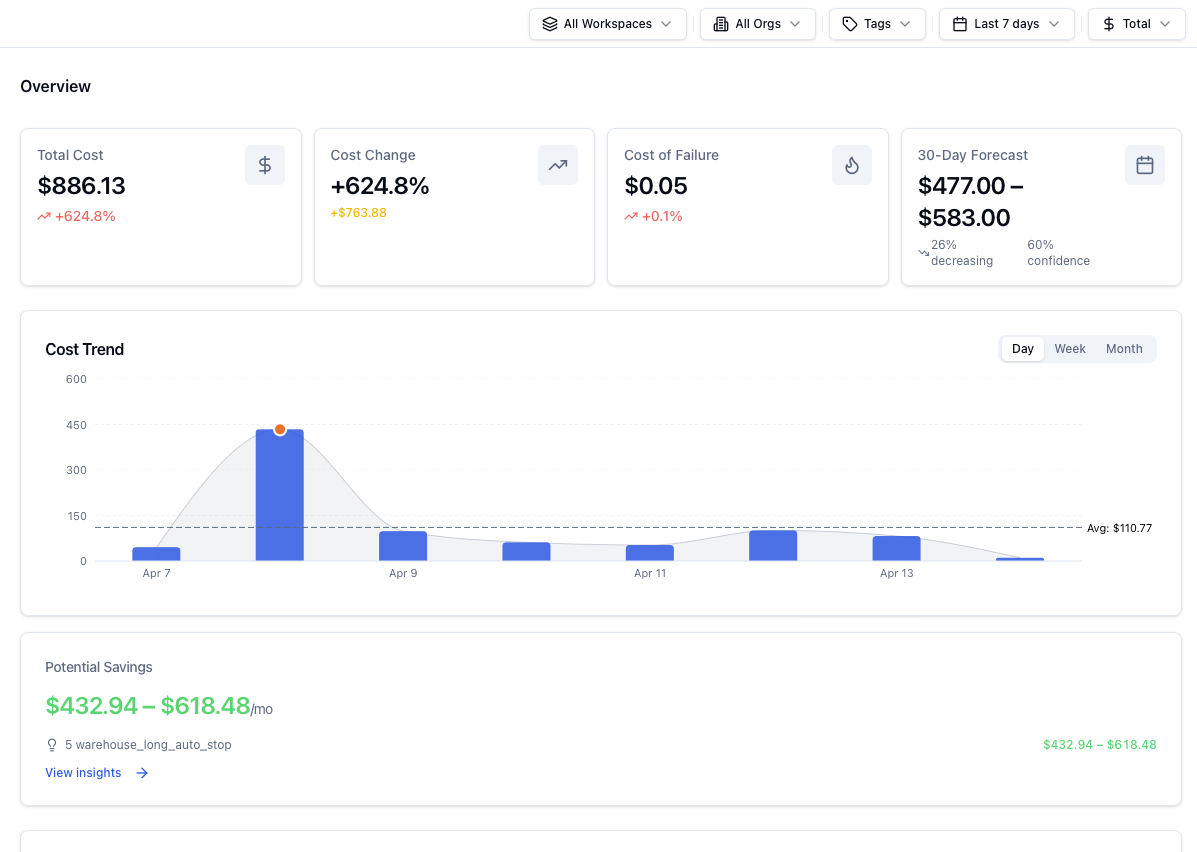
Most teams can get to visibility. They can pull usage exports, query system tables, and build dashboards that show totals by day, SKU, workspace, or cluster. That part is genuinely solved. The harder part is what comes next: when the number moves, the dashboard confirms that something shifted, but it doesn’t say which workload drove the delta, who owns it, or whether it was expected — a backfill, a new pipeline, a traffic spike? And it certainly doesn’t suggest what the safest next action is.
That’s the gap we kept running into with our clients, on project after project. Smart teams, good tooling, and still days lost to investigations that should have taken minutes — usually because the people who could explain the change weren’t the same people watching the dashboard, and the people watching the dashboard didn’t have enough context to act. The pattern was always some version of visibility without explainability, and it produced the same downstream effects every time: slow conversations, fuzzy ownership, and remediations risky enough that nobody really wanted to be the one to approve them.
… the people who could explain the change weren’t the same people watching the dashboard, and the people watching the dashboard didn’t have enough context to act.
The Pattern
Early on, a Databricks setup is easy. A few teams, a handful of pipelines, workloads you recognise on sight. Then adoption catches up: more teams, more jobs, streaming, warehouses for new use cases, separate environments — and the cost picture starts behaving in ways a monthly total can’t really explain.
The examples are familiar once you’ve seen a few. A retry loop kicks off after an upstream schema change and doubles compute for hours before anyone notices. A warehouse stays on after a traffic peak because nothing turned it back down. Clusters spun up for a project keep running long after the project wrapped. A backfill gets waved through as “expected,” except the window was supposed to close yesterday.
None of this means someone wasn’t paying attention — it’s just what happens on a platform doing real work for a lot of people at once.
Spotting the shift isn’t the hard part; most teams see it by the next morning. The hard part is the story behind it — which workload moved, why, whether it’ll keep moving, and what’s safe to do about it. Without that story, the investigation drags, ownership gets fuzzy, and the fix turns into something nobody really wants to approve.
Then adoption catches up: more teams, more jobs, streaming, warehouses for new use cases, separate environments — and the cost picture starts behaving in ways a monthly total can’t really explain.
Scaling Your Cost Understanding
Databricks is built to scale — more workloads, more teams, more data, more velocity. That’s the point of it, and it’s one of the main reasons why people pick it.
Cost understanding tends to scale more slowly, because it depends on things that don’t show up automatically with adoption: someone who clearly owns a given workload or warehouse, an attribution model that holds up when teams reorg or pipelines get renamed, and a workflow the org actually uses to review changes and decide what to do about them. When any of those are missing, spend just becomes background noise until something spikes hard enough to force a conversation.
And that conversation usually plays out the same way. A platform owner opens the dashboards and exports. People spend a while debating whether the number is even real or a billing mistake. Someone asks who owns the workload, and the answer is some version of “kind of us, kind of them.” The team burns a day or two hunting for a plausible explanation, and by the time someone proposes a fix, everyone hesitates — because the blast radius isn’t clear and nobody wants to be the one who broke production trying to save DBUs.
The longer that loop takes, the more it costs — and not just in dollars. It also costs attention, which is the scarcer resource on most platform teams.
Explainability is the Point
Databricks provides some quite robust cost monitoring capabilities out of the box. The exports, system tables, and dashboards Databricks gives you are genuinely useful, and any team running the platform seriously ends up leaning on them.
The problem is that most of the operational pain doesn’t come from the question “what’s the total?”. It comes from the next question: what changed, and why? And answering that one means connecting three things quickly: the driver, the context around it, and the owner — the person who can say whether this was expected and decide what to do next.
That’s really what we mean by Databricks cost transparency: enough of an explanation that the team can act on it, before a delta turns into an incident.
The problem is that most of the operational pain doesn’t come from the question “what’s the total?”. It comes from the next question: what changed, and why?
Automation Should Always Come with Control
In practice, automation tends to work best when it follows a progression rather than landing all at once. The first step is read-only discovery — surfacing the drivers quickly and consistently, without anything moving yet.
The second is approval with a real audit trail: when a remediation gets suggested (stop something idle, right-size a warehouse, clean up a cluster nobody’s claimed in weeks), the team should be able to see why it was suggested, approve it explicitly, and look back later at who approved what and on what basis. Only once that loop is genuinely trusted does it make sense to let some of those actions run on their own. And even then, it should be opt-in, bounded, and reversible.
That last word matters more than people tend to expect. Control isn’t the opposite of speed; it’s the thing that makes speed safe to use. The principle we ended up building LakeSentry around is a simple one: automation shouldn’t outrun explainability.
Control isn’t the opposite of speed; it’s the thing that makes speed safe to use.
What We Built LakeSentry to Do
Everything in LakeSentry is oriented around shortening the time from “spend changed” to “we understand why, and we know what to do next.”
In practical terms, that means helping teams:
- Find the main cost drivers quickly (in a way that matches how the org thinks: by workload, owner, environment)
- Preserve ownership so “shared” doesn’t turn into “nobody”
- Detect meaningful changes early, with evidence attached
- Take action with guardrails (read-only → approve → opt-in automation)
For a deeper walkthrough of the architecture and how each piece fits together, see how LakeSentry works in the docs.
The “Visibility → Explainability → Safe Action” Ladder
We didn’t want to start with the Databricks cost optimization pitch because the teams we work with aren’t short on reasons to optimize, they’re short on the confidence to act: what’s really driving the spend, who owns it, and whether the fix is safe.
So we built LakeSentry in that order. Explain first, then make the action safe, then make the loop repeatable. Optimization follows from that.
If you’re evaluating your own setup, here’s a simple framework:
- Visibility: you can see totals and trends
- Explainability: you can attribute a change to a driver + owner, quickly
- Safe action: you can remediate with guardrails and auditability
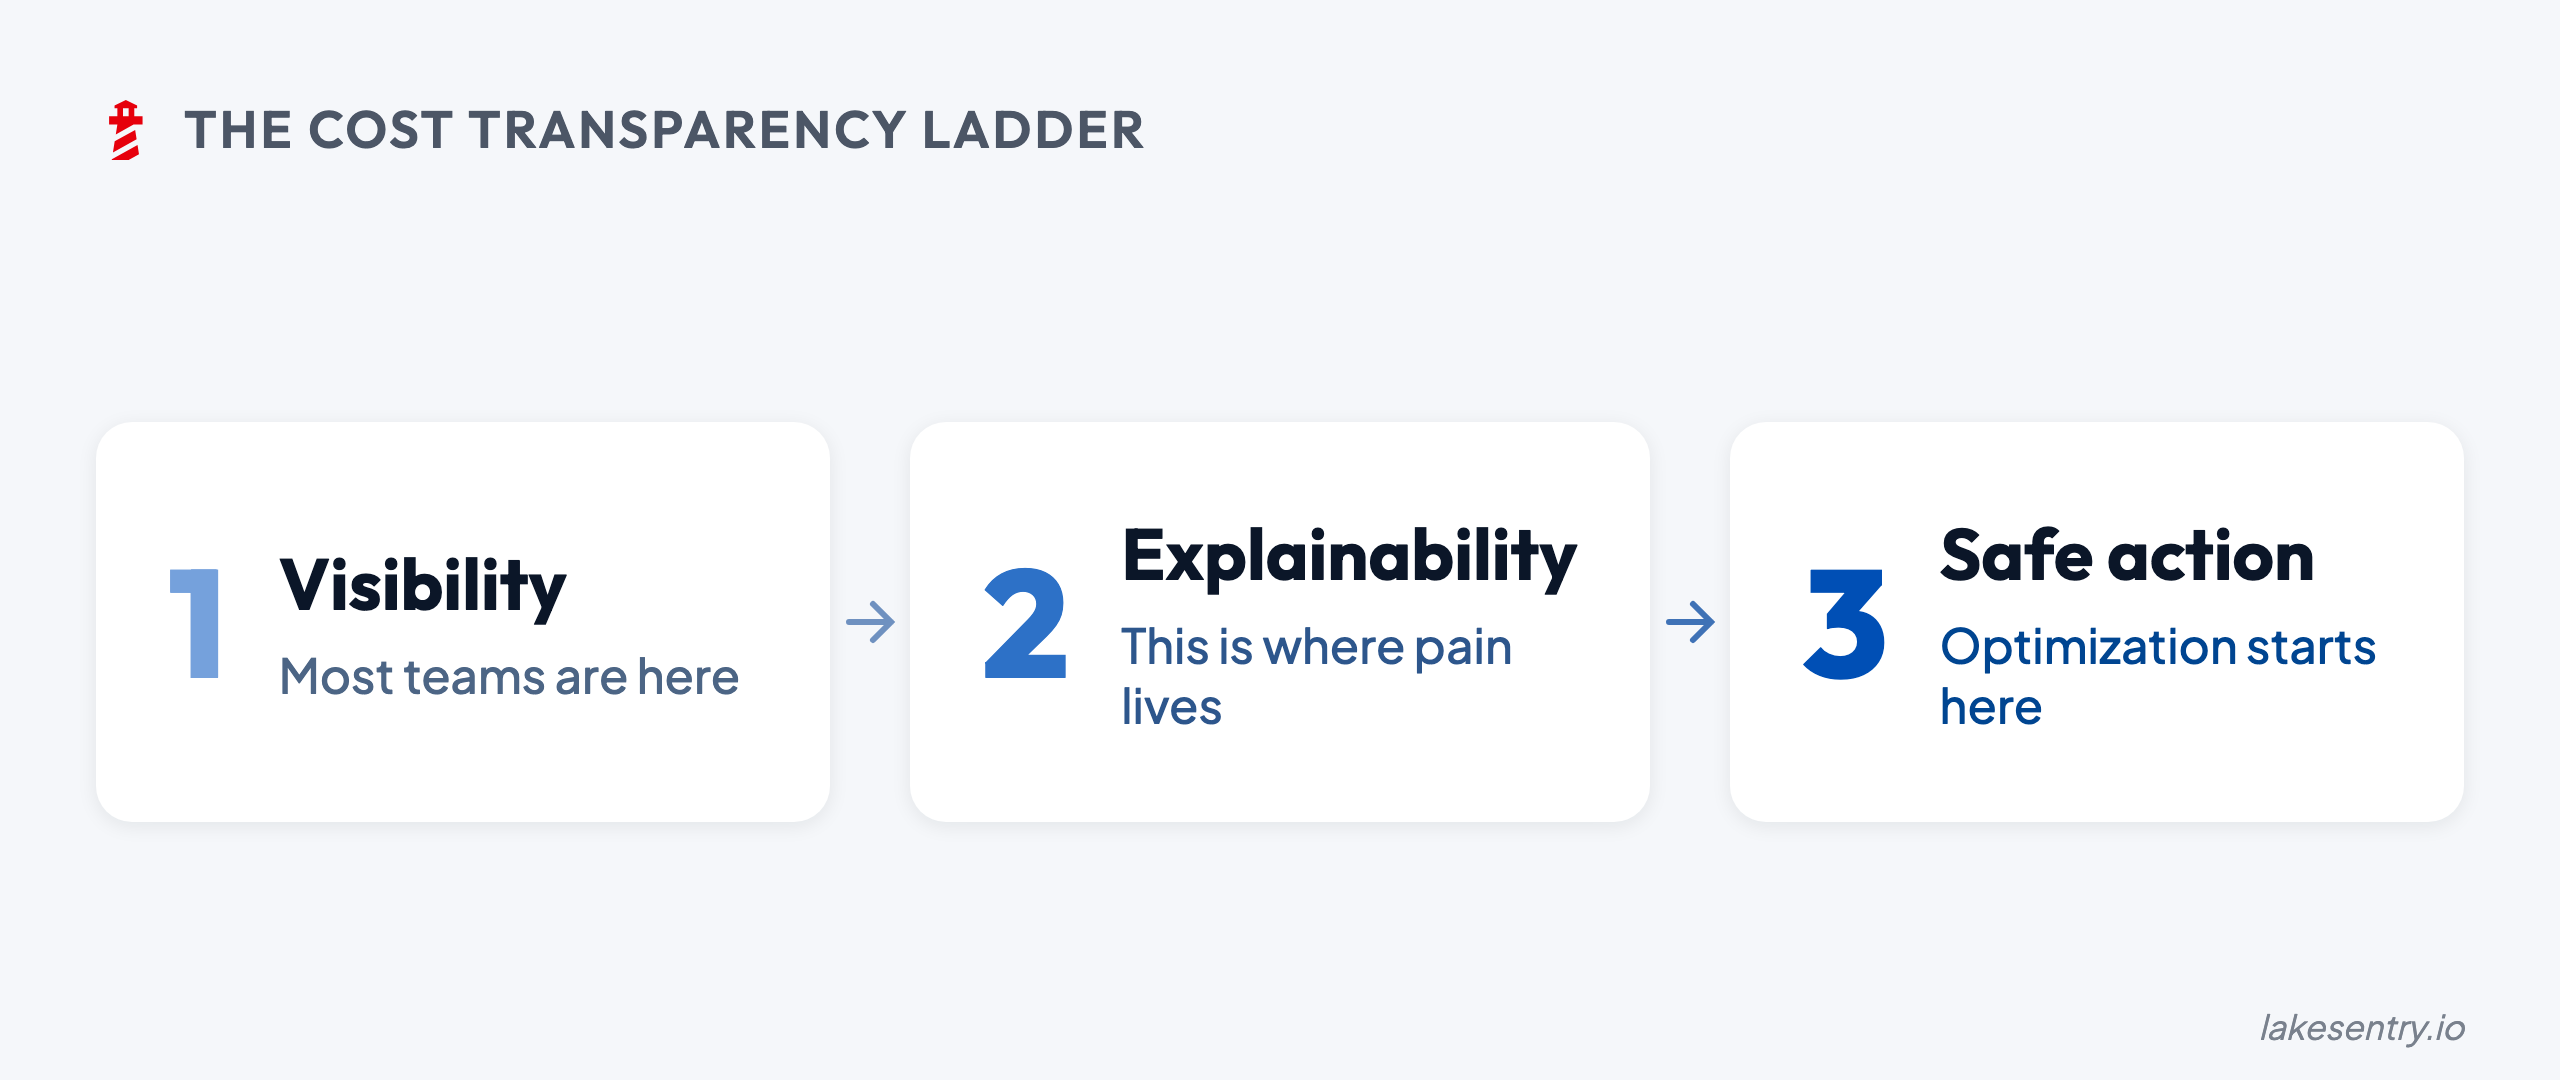
Most teams have step 1, but pain lives in steps 2 and 3.
LakeSentry is built for those steps — because they’re the ones that turn cost data into operational clarity.
The Next Step
If you’re evaluating cost transparency for Databricks and want to talk through what “enough” looks like for your environment, you can always reach out to us, and we would be happy to discuss your case.
See what your Databricks environment is actually doing
Free tier — unlimited workspaces, no credit card. Connect in minutes.
Related reading
LakeSentry, the cost observability platform for Databricks, is now available as a native Databricks App on the Marketplace. What it means, and where it runs.
FinOps for Databricks stalls when teams optimize before they can explain spend. Build transparency first: attribution, explainability, shared definitions.
Native Databricks cost tools show totals from billing exports, system tables, and dashboards. They don't say what changed, who owns it, or what to do.
Evaluating Databricks cost tools? Compare them side by side →